VCE General Maths Data Analysis 2020 Mini Test 1
This is the full VCE General Maths Exam with worked solutions. You can also try Mini-Tests, which are official VCAA exams split into short tests you can do anytime.
Number of marks: 9
Reading time: 3 minutes
Writing time: 20 minutes
Instructions
• Answer all questions in pencil on your Multiple-Choice Answer Sheet.
• Choose the response that is correct for the question.
• A correct answer scores 1; an incorrect answer scores 0.
• Marks will not be deducted for incorrect answers.
• No marks will be given if more than one answer is completed for any question.
• Unless otherwise indicated, the diagrams in this book are not drawn to scale.
Data analysis - 2020 (Part 1)
Of these 800 times, the number of times that are longer than 300 milliseconds is closest to
- A. 20
- B. 25
- C. 75
- D. 200
- E. 400
The shape of the distribution of these 800 times is best described as
- A. approximately symmetric.
- B. positively skewed.
- C. positively skewed with one or more outliers.
- D. negatively skewed.
- E. negatively skewed with one or more outliers.
The histogram below shows the distribution of the forearm circumference, in centimetres, of 252 men. Assume that the forearm circumference values were all rounded to one decimal place.
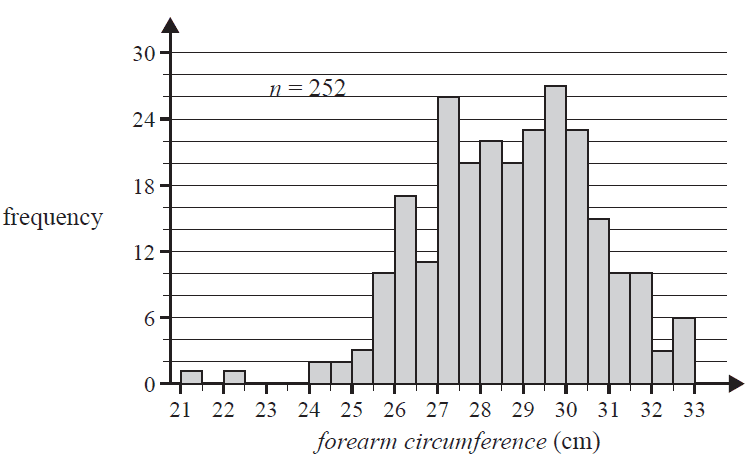
The third quartile (\(Q_3\)) for this distribution could be
- A. 29.3
- B. 29.8
- C. 30.3
- D. 30.8
- E. 31.3
The histogram below shows the distribution of weight, in grams, for a sample of 20 animal species. The histogram has been plotted on a \(\log_{10}\) scale.
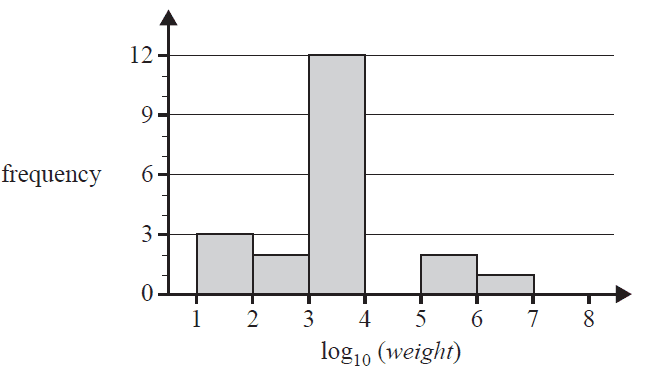
The percentage of these animal species with a weight of less than 10 000 g is
- A. 17%
- B. 70%
- C. 75%
- D. 80%
- E. 85%
A percentaged segmented bar chart would be an appropriate graphical tool to display the association between month of the year (January, February, March, etc.) and the
- A. monthly average rainfall (in millimetres).
- B. monthly mean temperature (in degrees Celsius).
- C. annual median wind speed (in kilometres per hour).
- D. monthly average rainfall (below average, average, above average).
- E. annual average temperature (in degrees Celsius).
Data relating to the following five variables was collected from insects that were caught overnight in a trap:
- colour
- name of species
- number of wings
- body length (in millimetres)
- body weight (in milligrams)
The number of these variables that are discrete numerical variables is
- A. 1
- B. 2
- C. 3
- D. 4
- E. 5
The wing length of a species of bird is approximately normally distributed with a mean of 61 mm and a standard deviation of 2 mm.
Using the 68–95–99.7% rule, for a random sample of 10 000 of these birds, the number of these birds with a wing length of less than 57 mm is closest to
- A. 50
- B. 160
- C. 230
- D. 250
- E. 500
The lifetime of a certain brand of light globe, in hours, is approximately normally distributed.
It is known that 16% of the light globes have a lifetime of less than 655 hours and 50% of the light globes have a lifetime that is greater than 670 hours.
The mean and the standard deviation of this normal distribution are closest to
- A. mean = 655 hours, standard deviation = 10 hours
- B. mean = 655 hours, standard deviation = 15 hours
- C. mean = 670 hours, standard deviation = 10 hours
- D. mean = 670 hours, standard deviation = 15 hours
- E. mean = 670 hours, standard deviation = 20 hours
End of Multiple-Choice Question Book
VCE is a registered trademark of the VCAA. The VCAA does not endorse or make any warranties regarding this study resource. Past VCE exams and related content can be accessed directly at www.vcaa.vic.edu.au
