VCE General Maths Data Analysis 2021 Mini Test 2
This is the full VCE General Maths Exam with worked solutions. You can also try Mini-Tests, which are official VCAA exams split into short tests you can do anytime.
Number of marks: 8
Reading time: 3 minutes
Writing time: 18 minutes
Instructions
• Answer all questions in pencil on your Multiple-Choice Answer Sheet.
• Choose the response that is correct for the question.
• A correct answer scores 1; an incorrect answer scores 0.
• Marks will not be deducted for incorrect answers.
• No marks will be given if more than one answer is completed for any question.
• Unless otherwise indicated, the diagrams in this book are not drawn to scale.
Data analysis - 2021 (Part 2)
The heights of females living in a small country town are normally distributed:
- 16% of the females are more than 160 cm tall.
- 2.5% of the females are less than 115 cm tall.
The mean and the standard deviation of this female population, in centimetres, are closest to
- A. mean = 135, standard deviation = 15
- B. mean = 135, standard deviation = 25
- C. mean = 145, standard deviation = 15
- D. mean = 145, standard deviation = 20
- E. mean = 150, standard deviation = 10
Oscar walked for nine consecutive days. The time, in minutes, that Oscar spent walking on each day is shown in the table below.
| Day | 1 | 2 | 3 | 4 | 5 | 6 | 7 | 8 | 9 |
|---|---|---|---|---|---|---|---|---|---|
| Time | 46 | 40 | 45 | 34 | 36 | 38 | 39 | 40 | 33 |
A least squares line is fitted to the data. The equation of this line predicts that on day 10 the time Oscar spends walking will be the same as the time he spent walking on
- A. day 3
- B. day 4
- C. day 6
- D. day 8
- E. day 9
The table below shows the weight, in kilograms, and the height, in centimetres, of 10 adults.
| Weight (kg) | Height (cm) |
|---|---|
| 59 | 173 |
| 67 | 180 |
| 69 | 184 |
| 84 | 195 |
| 64 | 173 |
| 74 | 180 |
| 76 | 192 |
| 56 | 169 |
| 58 | 164 |
| 66 | 180 |
A least squares line is fitted to the data.
The least squares line enables an adult’s weight to be predicted from their height.
The number of times that the predicted value of an adult’s weight is greater than the actual value of their weight is
- A. 3
- B. 4
- C. 5
- D. 6
- E. 7
The time series plot below shows the quarterly sales, in thousands of dollars, of a small business for the years 2010 to 2020.
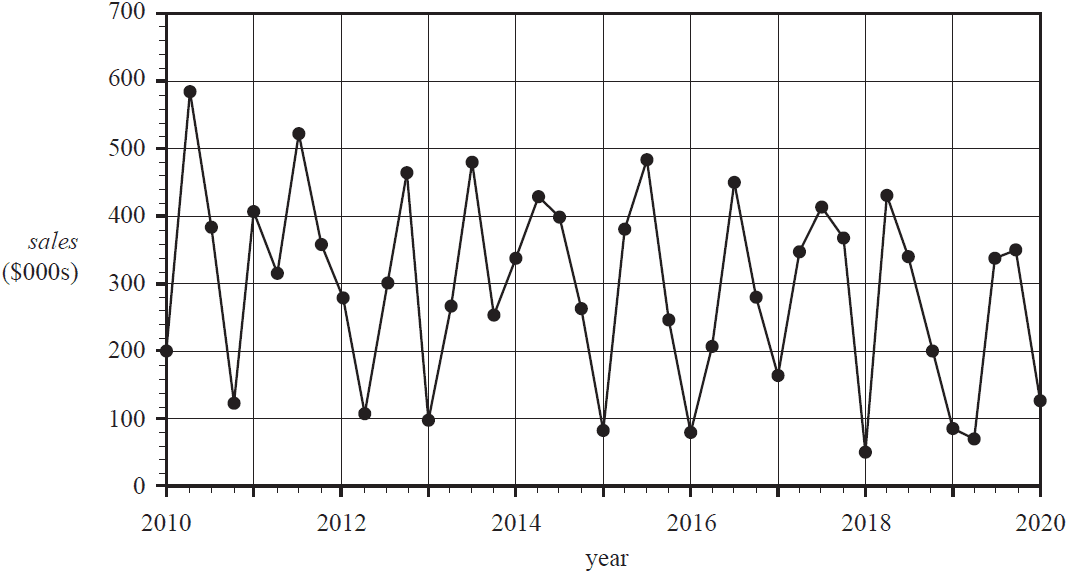
The time series plot is best described as having
- A. seasonality only.
- B. irregular fluctuations only.
- C. seasonality with irregular fluctuations.
- D. a decreasing trend with irregular fluctuations.
- E. a decreasing trend with seasonality and irregular fluctuations.
The time series plot below shows the points scored by a basketball team over 40 games.
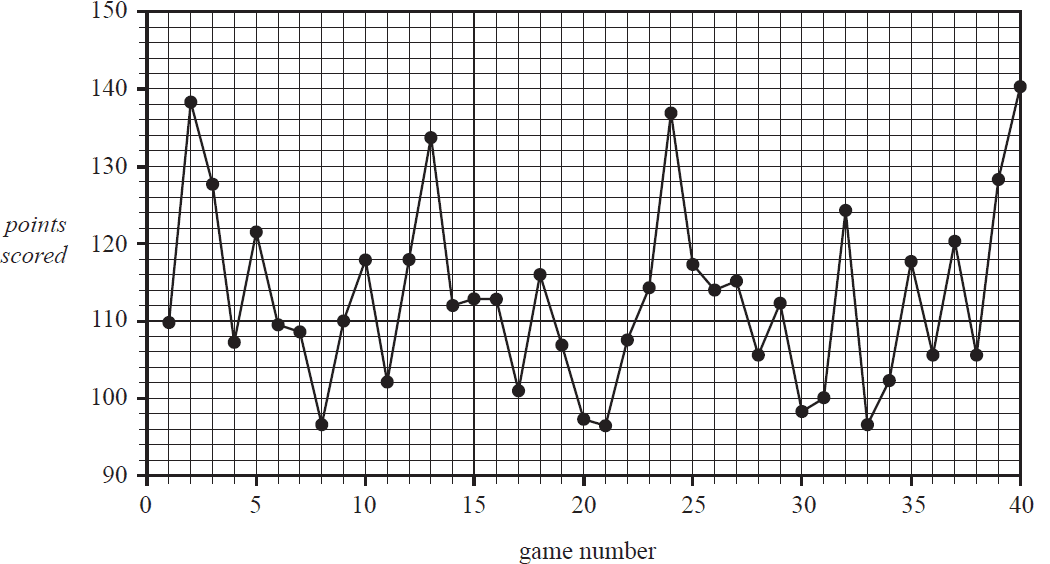
The nine-median smoothed points scored for game number 10 is closest to
- A. 102
- B. 108
- C. 110
- D. 112
- E. 117
A garden centre sells garden soil. The table below shows the daily quantity of garden soil sold, in cubic metres, over a one-week period.
| Day | Monday | Tuesday | Wednesday | Thursday | Friday | Saturday | Sunday |
|---|---|---|---|---|---|---|---|
| Quantity (m³) | 234 | 186 | 346 | 346 |
The quantity of garden soil sold on Wednesday, Thursday and Friday is not shown.
The five-mean smoothed quantity of garden soil sold on Thursday is 206 m³.
The three-mean smoothed quantity of garden soil sold on Thursday, in cubic metres, is
- A. 143
- B. 166
- C. 206
- D. 239
- E. 403
The table below shows the number of visitors to an art gallery during the summer, autumn, winter and spring quarters for the years 2017 to 2019. The quarterly average is also shown for each of these years.
| Season | 2017 | 2018 | 2019 |
|---|---|---|---|
| summer quarter | 29 685 | 25 420 | 31 496 |
| autumn quarter | 27 462 | 23 320 | 29 874 |
| winter quarter | 25 564 | 21 097 | 27 453 |
| spring quarter | 26 065 | 22 897 | 28 149 |
| Quarterly average | 27 194.0 | 23 183.5 | 29 243.0 |
The seasonal index for summer is closest to
- A. 1.077
- B. 1.081
- C. 1.088
- D. 1.092
- E. 1.096
The number of visitors to a regional animal park is seasonal. Data is collected and deseasonalised before a least squares line is fitted. The equation of the least squares line is
deseasonalised number of visitors = 2349 – 198.5 × month number
where month number 1 is January 2020. The seasonal indices for the 12 months of 2020 are shown in the table below.
| Month number | 1 | 2 | 3 | 4 | 5 | 6 | 7 | 8 | 9 | 10 | 11 | 12 |
|---|---|---|---|---|---|---|---|---|---|---|---|---|
| Seasonal index | 1.10 | 1.25 | 1.15 | 0.95 | 0.85 | 0.75 | 0.80 | 0.85 | 0.95 | 1.10 | 1.15 | 1.10 |
The actual number of visitors predicted for February 2020 was closest to
- A. 1562
- B. 1697
- C. 1952
- D. 2245
- E. 2440
End of Multiple-Choice Question Book
VCE is a registered trademark of the VCAA. The VCAA does not endorse or make any warranties regarding this study resource. Past VCE exams and related content can be accessed directly at www.vcaa.vic.edu.au
