VCE General Maths Data Analysis 2021 Mini Test 1
This is the full VCE General Maths Exam with worked solutions. You can also try Mini-Tests, which are official VCAA exams split into short tests you can do anytime.
Number of marks: 8
Reading time: 3 minutes
Writing time: 18 minutes
Instructions
• Answer all questions in pencil on your Multiple-Choice Answer Sheet.
• Choose the response that is correct for the question.
• A correct answer scores 1; an incorrect answer scores 0.
• Marks will not be deducted for incorrect answers.
• No marks will be given if more than one answer is completed for any question.
• Unless otherwise indicated, the diagrams in this book are not drawn to scale.
Data analysis - 2021 (Part 1)
SECTION A – Core
Data analysis
Use the following information to answer Questions 1–3.
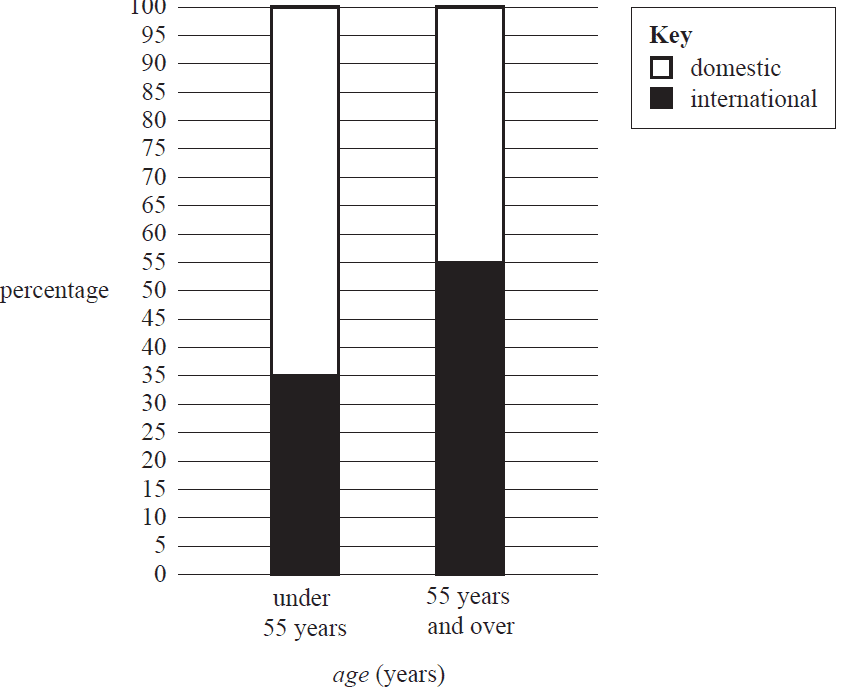
The percentaged segmented bar chart below shows the age (under 55 years, 55 years and over) of visitors at a travel convention, segmented by preferred travel destination (domestic, international).
The variables age (under 55 years, 55 years and over) and preferred travel destination (domestic, international) are
- A. both categorical variables.
- B. both numerical variables.
- C. a numerical variable and a categorical variable respectively.
- D. a categorical variable and a numerical variable respectively.
- E. a discrete variable and a continuous variable respectively.
The data displayed in the percentaged segmented bar chart supports the contention that there is an association between preferred travel destination and age because
- A. more visitors favour international travel.
- B. 35% of visitors under 55 years favour international travel.
- C. 45% of visitors 55 years and over favour domestic travel.
- D. 65% of visitors under 55 years favour domestic travel while 45% of visitors 55 years and over favour domestic travel.
- E. the percentage of visitors who prefer domestic travel is greater than the percentage of visitors who prefer international travel.
The results could also be summarised in a two-way frequency table. Which one of the following frequency tables could match the percentaged segmented bar chart?
- A.
Age Preferred travel destination Under 55 years 55 years and over domestic 91 90 international 49 110 Total 140 200 - B.
Age Preferred travel destination Under 55 years 55 years and over domestic 65 35 international 45 55 Total 110 90 - C.
Age Preferred travel destination Under 55 years 55 years and over domestic 35 55 international 65 45 Total 100 100 - D.
Age Preferred travel destination Under 55 years 55 years and over domestic 50 70 international 100 50 Total 150 120 - E.
Age Preferred travel destination Under 55 years 55 years and over domestic 71 39 international 29 61 Total 100 100
The boxplots below show the distribution of the length of fish caught in two different ponds, Pond A and Pond B.
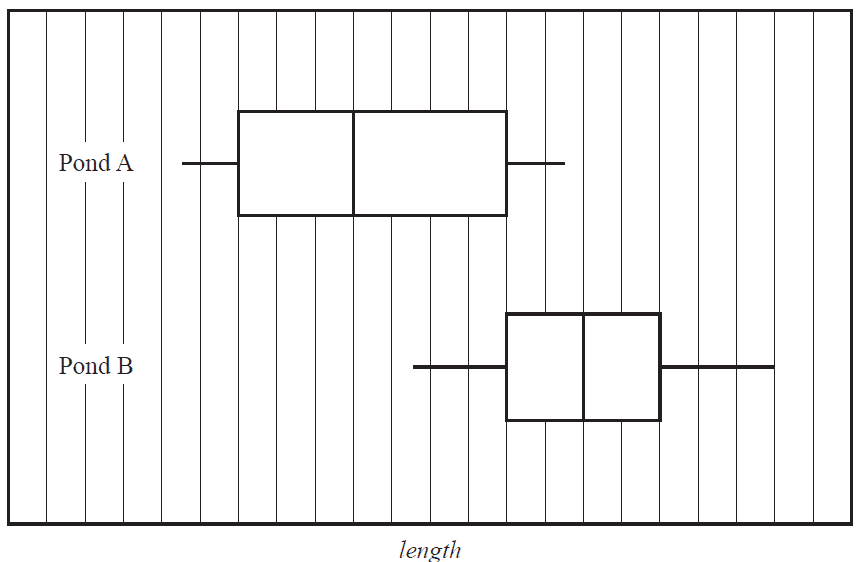
Based on the boxplots above, it can be said that
- A. 50% of the fish caught in Pond A are the same length as the fish caught in Pond B.
- B. 50% of the fish caught in Pond B are longer than all of the fish caught in Pond A.
- C. 50% of the fish caught in Pond B are shorter than all of the fish caught in Pond A.
- D. 75% of the fish caught in Pond A are shorter than all of the fish caught in Pond B.
- E. 75% of the fish caught in Pond B are longer than all of the fish caught in Pond A.
The stem plot below shows the height, in centimetres, of 20 players in a junior football team.
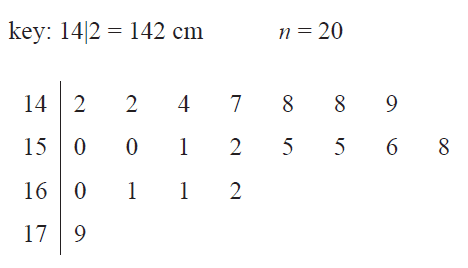
A player with a height of 179 cm is considered an outlier because 179 cm is greater than
- A. 162 cm
- B. 169 cm
- C. 172.5 cm
- D. 173 cm
- E. 175.5 cm
The relationship between resting pulse rate, in beats per minute, and age group (15–20 years, 21–30 years, 31–50 years, over 50 years) is best displayed using
- A. a histogram.
- B. a scatterplot.
- C. parallel boxplots.
- D. a time series plot.
- E. a back-to-back stem plot.
Use the following information to answer Questions 7 and 8.
800 participants auditioned for a stage musical. Each participant was required to complete a series of ability tests for which they received an overall score.
The overall scores were approximately normally distributed with a mean score of 69.5 points and a standard deviation of 6.5 points.
Only the participants who scored at least 76.0 points in the audition were considered successful.
Using the 68–95–99.7% rule, how many of the participants were considered unsuccessful?
- A. 127
- B. 128
- C. 272
- D. 672
- E. 673
To be offered a leading role in the stage musical, a participant must achieve a standardised score of at least 1.80.
Three participants’ names and their overall scores are given in the table below.
| Participant | Overall score |
|---|---|
| Amy | 81.5 |
| Brian | 80.5 |
| Cherie | 82.0 |
Which one of the following statements is true?
- A. Only Amy was offered a leading role.
- B. Only Cherie was offered a leading role.
- C. Only Brian was not offered a leading role.
- D. Both Brian and Cherie were offered leading roles.
- E. All three participants were offered leading roles.
End of Multiple-Choice Question Book
VCE is a registered trademark of the VCAA. The VCAA does not endorse or make any warranties regarding this study resource. Past VCE exams and related content can be accessed directly at www.vcaa.vic.edu.au
