VCE General Maths Data Analysis 2022 Mini Test 2
This is the full VCE General Maths Exam with worked solutions. You can also try Mini-Tests, which are official VCAA exams split into short tests you can do anytime.
Number of marks: 8
Reading time: 3 minutes
Writing time: 18 minutes
Instructions
• Answer all questions in pencil on your Multiple-Choice Answer Sheet.
• Choose the response that is correct for the question.
• A correct answer scores 1; an incorrect answer scores 0.
• Marks will not be deducted for incorrect answers.
• No marks will be given if more than one answer is completed for any question.
• Unless otherwise indicated, the diagrams in this book are not drawn to scale.
Data analysis - 2022 (Part 2)
Use the following information to answer Questions 9–11.
Table 1 summarises the results of a study that compared the effectiveness of individual and group instruction (instructional method) when training future basketball referees.
Table 1
| Test grade | Instructional method | |
|---|---|---|
| Individual | Group | |
| A (85% or above) | 10 | 18 |
| B (75–84%) | 35 | 30 |
| C (65–74%) | 30 | 24 |
| D (50–64%) | 28 | 48 |
| E (less than 50%) | 12 | 6 |
| Total | 115 | 126 |
In this table, test grade is the response variable and instructional method is the explanatory variable.
Question 1The variables test grade (A, B, C, D, E) and instructional method (individual, group) are
- A. a numerical and a categorical variable respectively.
- B. both nominal variables.
- C. a nominal and an ordinal variable respectively.
- D. both ordinal variables.
- E. an ordinal and a nominal variable respectively.
Of the students who received an A grade, the percentage who were instructed individually is closest to
- A. 9%
- B. 22%
- C. 36%
- D. 56%
- E. 64%
To become a qualified referee, a grade of A or B on the test is required. Those who receive a C, a D or an E
will not qualify.
Using column percentages, a new two-way percentage frequency table is constructed from the data in
Table 1.
In this new table, qualified to be a referee (yes, no) is the response variable and instructional method
(individual, group) is the explanatory variable.
Which one of the following tables correctly displays the data from Table 1?
A.
| Qualified to be a referee | Instructional method (%) | |
|---|---|---|
| Individual | Group | |
| yes (A or B grade) | 35 | 38 |
| no (C, D or E grade) | 65 | 62 |
B.
| Qualified to be a referee | Instructional method (%) | |
|---|---|---|
| Individual | Group | |
| yes (A or B grade) | 39 | 38 |
| no (C, D or E grade) | 61 | 62 |
C.
| Qualified to be a referee | Instructional method (%) | |
|---|---|---|
| Individual | Group | |
| yes (A or B grade) | 39 | 43 |
| no (C, D or E grade) | 61 | 57 |
D.
| Qualified to be a referee | Instructional method (%) | |
|---|---|---|
| Individual | Group | |
| yes (A or B grade) | 61 | 62 |
| no (C, D or E grade) | 39 | 38 |
E.
| Qualified to be a referee | Instructional method (%) | |
|---|---|---|
| Individual | Group | |
| yes (A or B grade) | 65 | 57 |
| no (C, D or E grade) | 35 | 43 |
Use the following information to answer Questions 12–14.
The scatterplot below displays the body length, in centimetres, of 17 crocodiles, plotted against their head length, in centimetres. A least squares line has been fitted to the scatterplot. The explanatory variable is head length.
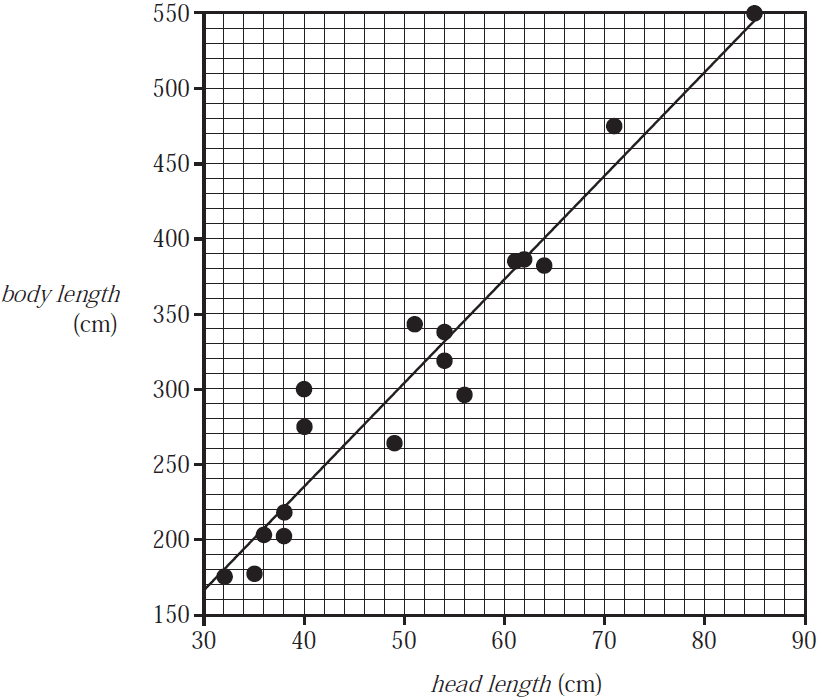
The equation of the least squares line is closest to
- A. \(\textit{head length} = -40 + 7 \times \textit{body length}\)
- B. \(\textit{body length} = -40 + 7 \times \textit{head length}\)
- C. \(\textit{head length} = 168 + 7 \times \textit{body length}\)
- D. \(\textit{body length} = 168 - 40 \times \textit{head length}\)
- E. \(\textit{body length} = 7 + 168 \times \textit{head length}\)
The median head length of the 17 crocodiles, in centimetres, is closest to
- A. 49
- B. 51
- C. 54
- D. 300
- E. 345
The correlation coefficient \(r\) is equal to 0.963
The percentage of variation in body length that is not explained by the variation in head length is closest to
- A. 0.9%
- B. 3.7%
- C. 7.3%
- D. 92.7%
- E. 96.3%
The daily number of cups of coffee sold by a food truck over a three-week period is shown in the table below.
| Week | Monday | Tuesday | Wednesday | Thursday | Friday | Saturday | Sunday |
|---|---|---|---|---|---|---|---|
| 1 | 123 | 91 | 120 | 176 | 145 | 99 | 187 |
| 2 | 98 | 104 | 145 | 163 | 134 | 128 | 206 |
| 3 | 125 | 134 | 128 | 187 | 156 | 102 | 179 |
The six-mean smoothed number of cups of coffee, with centring, sold on Thursday in Week 2 is closest to
- A. 127
- B. 138
- C. 147
- D. 155
- E. 163
The seasonal index for sales of sunscreen in summer is 1.25
To correct for seasonality, the actual sunscreen sales for summer should be
- A. reduced by 20%
- B. reduced by 25%
- C. reduced by 80%
- D. increased by 20%
- E. increased by 25%
End of Multiple-Choice Question Book
VCE is a registered trademark of the VCAA. The VCAA does not endorse or make any warranties regarding this study resource. Past VCE exams and related content can be accessed directly at www.vcaa.vic.edu.au
