VCE General Maths Data Analysis 2023 Mini Test 2
This is the full VCE General Maths Exam with worked solutions. You can also try Mini-Tests, which are official VCAA exams split into short tests you can do anytime.
Number of marks: 8
Reading time: 3 minutes
Writing time: 18 minutes
Instructions
• Answer all questions in pencil on your Multiple-Choice Answer Sheet.
• Choose the response that is correct for the question.
• A correct answer scores 1; an incorrect answer scores 0.
• Marks will not be deducted for incorrect answers.
• No marks will be given if more than one answer is completed for any question.
• Unless otherwise indicated, the diagrams in this book are not drawn to scale.
Data analysis - 2023 (Part 2)
A least squares line can be used to model the birth rate (children per 1000 population) in a country from the average daily food energy intake (megajoules) in that country. When a least squares line is fitted to data from a selection of countries it is found that:
- for a country with an average daily food energy intake of 8.53 megajoules, the birth rate will be 32.2 children per 1000 population
- for a country with an average daily food energy intake of 14.9 megajoules, the birth rate will be 9.9 children per 1000 population.
The slope of this least squares line is closest to
- A. –4.7
- B. –3.5
- C. –0.29
- D. 2.7
- E. 25
A study of Year 10 students shows that there is a negative association between the scores of topic tests and the time spent on social media. The coefficient of determination is 0.72. From this information it can be concluded that
- A. a decreased time spent on social media is associated with an increased topic test score.
- B. less time spent on social media causes an increase in topic test performance.
- C. an increased time spent on social media is associated with an increased topic test score.
- D. too much time spent on social media causes a reduction in topic test performance.
- E. a decreased time spent on social media is associated with a decreased topic test score.
Use the following information to answer Questions 11 and 12.
The table below shows the height, in metres, and the age, in years, for 11 plantation trees. A scatterplot displaying this data is also shown.
| age (years) |
height (m) |
|---|---|
| 10 | 9.5 |
| 8 | 8.0 |
| 13 | 9.7 |
| 9 | 9.1 |
| 11 | 9.4 |
| 14 | 9.8 |
| 6 | 6.0 |
| 4 | 3.5 |
| 12 | 9.6 |
| 7 | 7.8 |
| 5 | 4.0 |
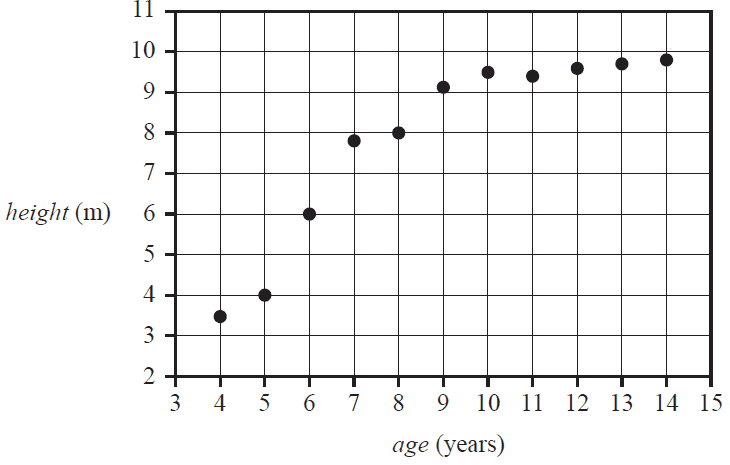
A reciprocal transformation applied to the variable age can be used to linearise the scatterplot.
With \( \frac{1}{\textit{age}} \) as the explanatory variable, the equation of the least squares line fitted to the linearised data is closest to
- A. \( \textit{height} = -13.04 + 40.22 \times \frac{1}{\textit{age}} \)
- B. \( \textit{height} = -10.74 + 8.30 \times \frac{1}{\textit{age}} \)
- C. \( \textit{height} = 2.14 + 0.63 \times \frac{1}{\textit{age}} \)
- D. \( \textit{height} = 13.04 - 40.22 \times \frac{1}{\textit{age}} \)
- E. \( \textit{height} = 16.56 - 22.47 \times \frac{1}{\textit{age}} \)
The scatterplot can also be linearised using a logarithm (base 10) transformation applied to the variable age. The equation of the least squares line is
\( \textit{height} = -3.8 + 12.6 \times \log_{10}(\textit{age}) \)
Using this equation, the age, in years, of a tree with a height of 8.52 m is closest to
- A. 7.9
- B. 8.9
- C. 9.1
- D. 9.5
- E. 9.9
Use the following information to answer Questions 13 and 14.
The following graph shows a selection of winning times, in seconds, for the women's 800 m track event from various athletic events worldwide. The graph shows one winning time for each calendar year from 2000 to 2022.
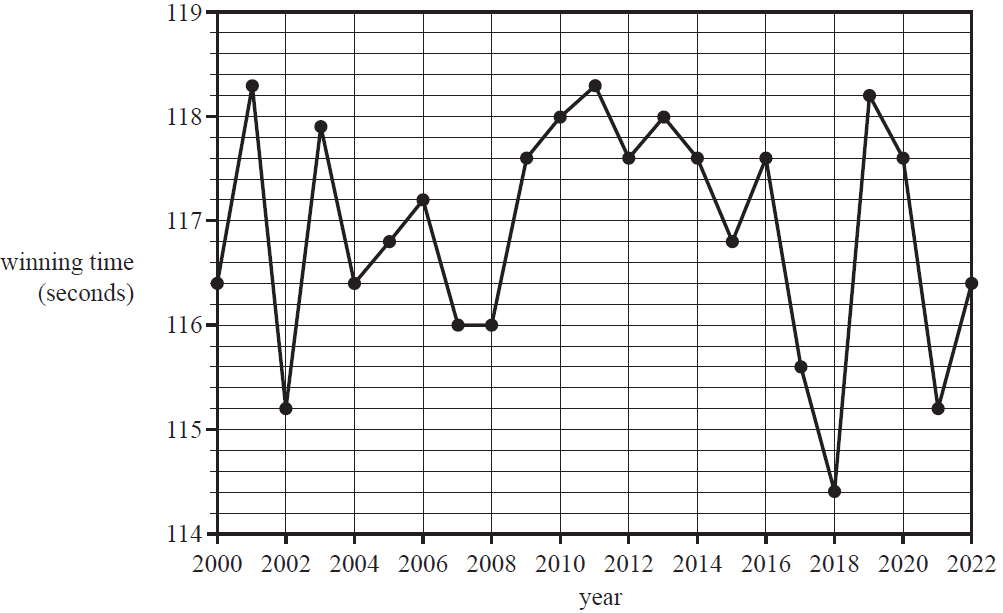
The time series is smoothed using seven-median smoothing. The smoothed value for the winning time in 2006, in seconds, is closest to
- A. 116.0
- B. 116.4
- C. 116.8
- D. 117.2
- E. 117.6
The median winning time, in seconds, for all the calendar years from 2000 to 2022 is closest to
- A. 116.8
- B. 117.2
- C. 117.6
- D. 118.0
- E. 118.3
The number of visitors to a public library each day for 10 consecutive days was recorded. These results are shown in the table below.
| Day number | 1 | 2 | 3 | 4 | 5 | 6 | 7 | 8 | 9 | 10 |
|---|---|---|---|---|---|---|---|---|---|---|
| Number of visitors | 337 | 317 | 313 | 335 | 322 | 335 | 322 | 338 | 302 | 349 |
The eight-mean smoothed number of visitors with centring for day number 6 is
- A. 323
- B. 324
- C. 325
- D. 326
- E. 327
The number of visitors each month to a zoo is seasonal. To correct the number of visitors in January for seasonality, the actual number of visitors, to the nearest percent, is increased by 35%.
The seasonal index for that month is closest to
- A. 0.61
- B. 0.65
- C. 0.69
- D. 0.74
- E. 0.77
End of Multiple-Choice Question Book
VCE is a registered trademark of the VCAA. The VCAA does not endorse or make any warranties regarding this study resource. Past VCE exams and related content can be accessed directly at www.vcaa.vic.edu.au
