VCE General Maths Data Analysis 2023 Mini Test 1
This is the full VCE General Maths Exam with worked solutions. You can also try Mini-Tests, which are official VCAA exams split into short tests you can do anytime.
Number of marks: 8
Reading time: 3 minutes
Writing time: 18 minutes
Instructions
• Answer all questions in pencil on your Multiple-Choice Answer Sheet.
• Choose the response that is correct for the question.
• A correct answer scores 1; an incorrect answer scores 0.
• Marks will not be deducted for incorrect answers.
• No marks will be given if more than one answer is completed for any question.
• Unless otherwise indicated, the diagrams in this book are not drawn to scale.
Data analysis - 2023 (Part 1)
Use the following information to answer Questions 1 and 2.
The dot plot below shows the times, in seconds, of 40 runners in the qualifying heats of their 800 m club championship.
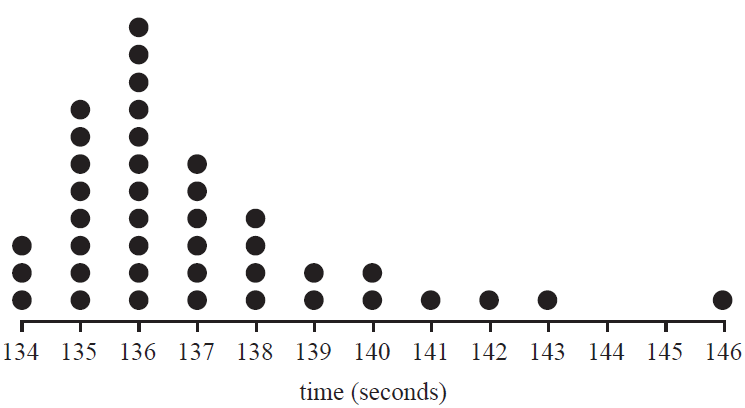
The median time, in seconds, of these runners is
- A. 135.5
- B. 136
- C. 136.5
- D. 137
- E. 137.5
The shape of this distribution is best described as
- A. positively skewed with one or more possible outliers.
- B. positively skewed with no outliers.
- C. approximately symmetric with one or more possible outliers.
- D. approximately symmetric with no outliers.
- E. negatively skewed with one or more possible outliers.
Gemma's favourite online word puzzle allows her 12 attempts to guess a mystery word. Her number of attempts for the last five days is displayed in the table below.
| Day | Number of attempts |
|---|---|
| 1 | 8 |
| 2 | 11 |
| 3 | 5 |
| 4 | 6 |
| 5 | 9 |
On day six, how many attempts can she make so that the mean number of attempts for these six days is exactly eight?
- A. 5
- B. 6
- C. 7
- D. 8
- E. 9
The time spent by visitors in a museum is approximately normally distributed with a mean of 82 minutes and a standard deviation of 11 minutes.
2380 visitors are expected to visit the museum today.
Using the 68–95–99.7% rule, the number of these visitors who are expected to spend between 60 and 104 minutes in the museum is
- A. 1128
- B. 1618
- C. 2256
- D. 2261
- E. 2373
The heights of a group of Year 8 students have a mean of 163.56 cm and a standard deviation of 8.14 cm. One student's height has a standardised \(z\)-score of –0.85.
This student's height, in centimetres, is closest to
- A. 155.4
- B. 156.6
- C. 162.7
- D. 170.5
- E. 171.7
The histogram below displays the distribution of prices, in dollars, of the cars for sale in a used-car yard. The histogram has a logarithm (base 10) scale.
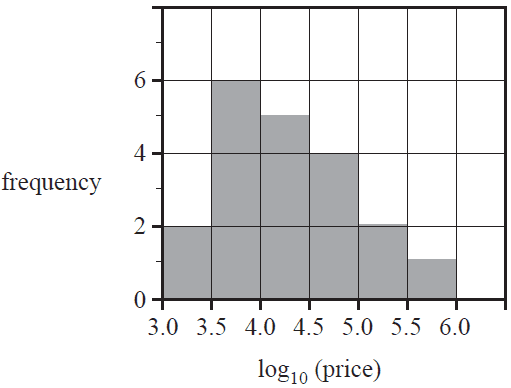
Six of the cars in the yard have the following prices:
- $2450
- $3175
- $4999
- $8925
- $10 250
- $105 600
How many of the six car prices listed above are in the modal class interval?
- A. 1
- B. 2
- C. 3
- D. 4
- E. 6
Use the following information to answer Questions 7 and 8.
A teacher analysed the class marks of 15 students who sat two tests. The test 1 mark and test 2 mark, all whole number values, are shown in the scatterplot below. A least squares line has been fitted to the scatterplot.
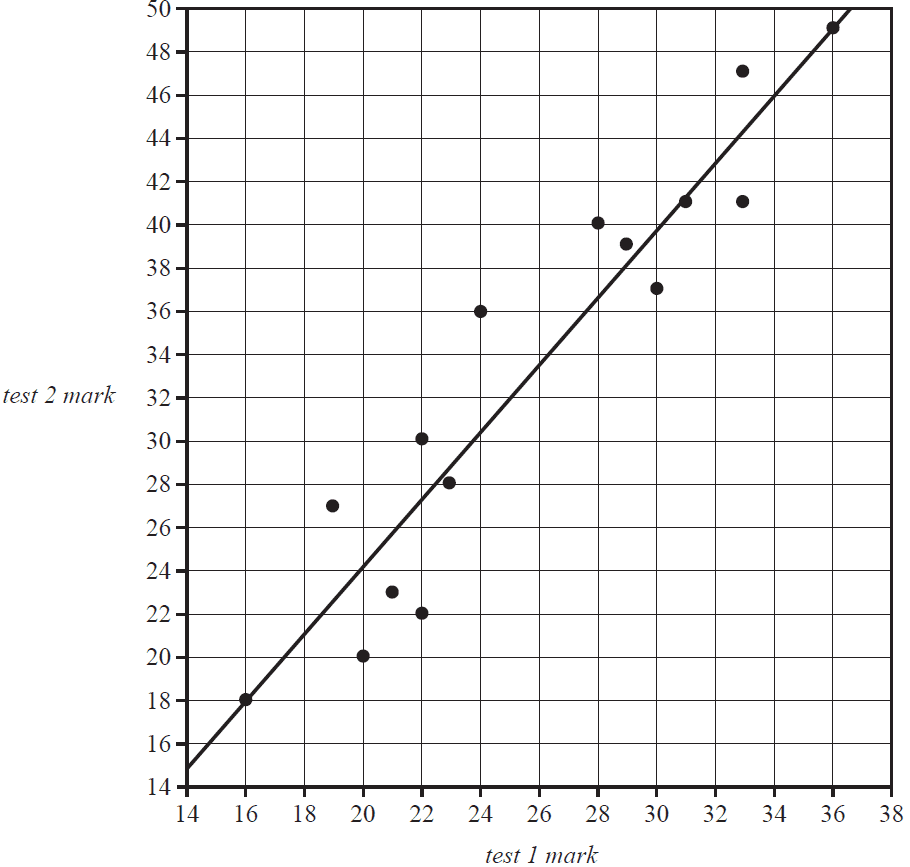
The equation of the least squares line is closest to
- A. test 2 mark = –6.83 + 1.55 × test 1 mark
- B. test 2 mark = 15.05 + 0.645 × test 1 mark
- C. test 2 mark = –6.78 + 0.645 × test 1 mark
- D. test 2 mark = 1.36 + 1.55 × test 1 mark
- E. test 2 mark = 6.83 + 1.55 × test 1 mark
The least squares line shows the predicted test 2 mark for each student based on their test 1 mark. The number of students whose actual test 2 mark was within two marks of that predicted by the line is
- A. 3
- B. 4
- C. 5
- D. 6
- E. 7
End of Multiple-Choice Question Book
VCE is a registered trademark of the VCAA. The VCAA does not endorse or make any warranties regarding this study resource. Past VCE exams and related content can be accessed directly at www.vcaa.vic.edu.au
