VCE General Maths Data Analysis 2024 Mini Test 1
VCAA General Maths Exam 1
This is the full VCE General Maths Exam with worked solutions. You can also try Mini-Tests, which are official VCAA exams split into short tests you can do anytime.
Number of marks: 8
Reading time: 3 minutes
Writing time: 18 minutes
Instructions
• Answer all questions in pencil on your Multiple-Choice Answer Sheet.
• Choose the response that is correct for the question.
• A correct answer scores 1; an incorrect answer scores 0.
• Marks will not be deducted for incorrect answers.
• No marks will be given if more than one answer is completed for any question.
• Unless otherwise indicated, the diagrams in this book are not drawn to scale.
Data analysis - 2024 (Part 1)
A group of students were asked to name their favourite colour.
The results are displayed in the percentage segmented bar chart below.
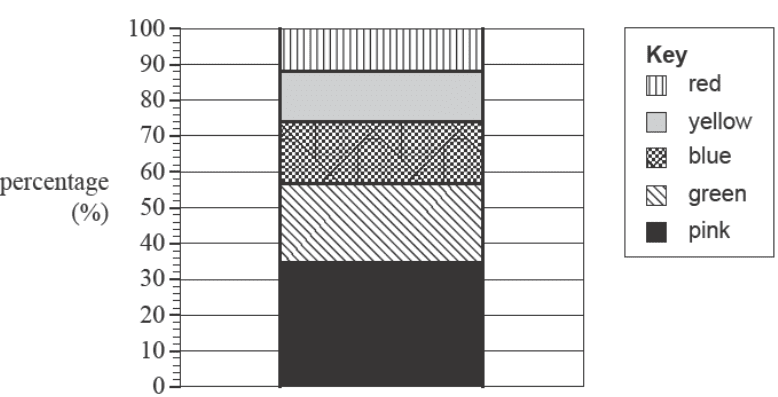
The percentage of students who named blue as their favourite colour is closest to
- A. 14%
- B. 18%
- C. 26%
- D. 74%
Freddie organised a function at work. He surveyed the staff about their preferences.
He asked them about their payment preference (cash or electronic payment) and their budget preference (less than $50 or more than $50).
The variables in this survey, payment preference and budget preference, are
- A. both categorical variables.
- B. both numerical variables.
- C. categorical and numerical variables, respectively.
- D. numerical and categorical variables, respectively.
Use the following information to answer Questions 3 and 4.
The histogram below displays the population density, in people per km², of the 27 countries in the European Union in 2021. The histogram has a logarithmic (base 10) scale.
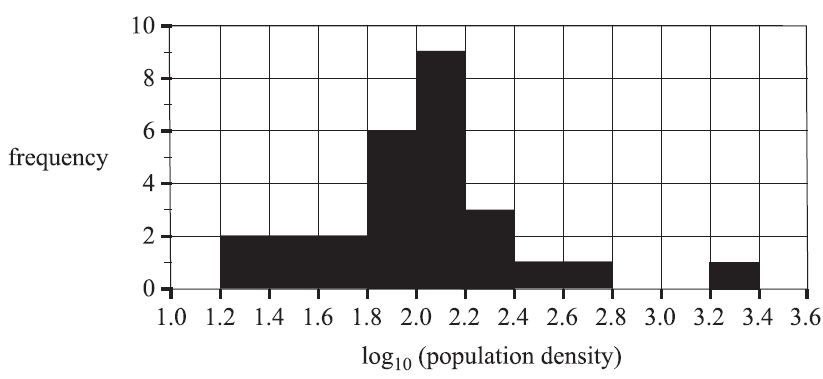
The median value occurs in a column with a frequency of
- A. 2
- B. 3
- C. 6
- D. 9
There is one outlier at the upper end of the histogram.
This value could be
- A. 330
- B. 1330
- C. 2030
- D. 2730
The number of siblings of each member of a class of 24 students was recorded.
The results are displayed in the table below.
| 2 | 1 | 3 | 2 | 1 | 1 | 1 | 4 | 1 | 1 | 1 | 1 |
| 1 | 2 | 1 | 2 | 2 | 1 | 3 | 4 | 2 | 2 | 3 | 1 |
A boxplot was constructed to display the spread of the data.
Which one of the following statements about this boxplot is correct?
- A. There are no outliers.
- B. The value of the interquartile range (IQR) is 1.5
- C. The value of the median is 1.5
- D. All of the five-number summary values are whole numbers.
More than 11 000 athletes from more than 200 countries competed in the Tokyo Summer Olympic Games.
An analysis of the number of athletes per country produced the following five-number summary.
| Minimum | First quartile | Median | Third quartile | Maximum |
|---|---|---|---|---|
| 2 | 5 | 11 | 48 | 613 |
The smallest number of athletes per country that would display as an outlier on a boxplot of this data is
- A. 49
- B. 112
- C. 113
- D. 613
Fiona plays nine holes of golf each week, and records her score.
Her mean score for all rounds in 2024 is 55.7
In one round, when she recorded a score of 48, her standardised score was \(z = -1.75\)
The standard deviation for score in 2024 is
- A. 1.1
- B. 2.3
- C. 4.4
- D. 6.95
The scatterplot below displays the average number of female athletes per competing nation, females, against the number of the Summer Olympic Games, number, from the first Olympic Games, in 1896, to the 29th Olympic Games, held in 2021.
A least squares line has been fitted to the scatterplot.
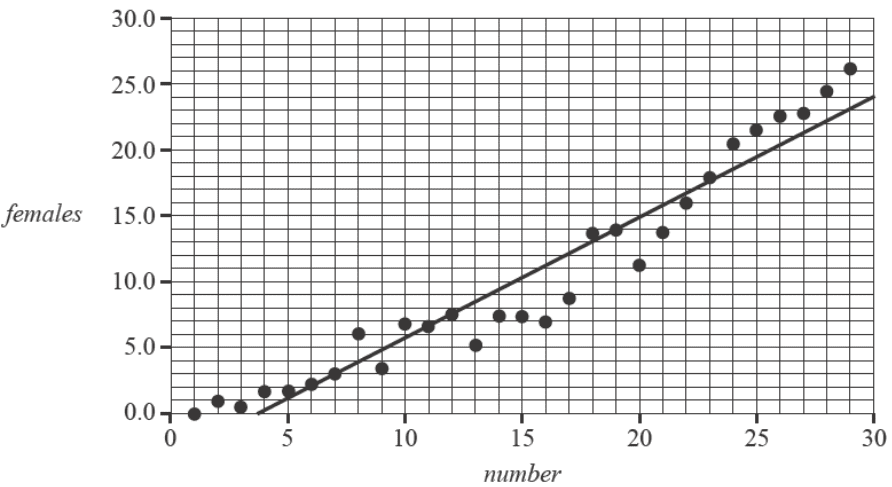
The equation of the least squares line is closest to
- A. females = -4.87 + 1.02 × number
- B. females = -3.39 + 0.91 × number
- C. number = -3.39 + 0.91 × females
- D. number = -0.91 + 3.39 × females
End of Multiple-Choice Question Book
VCE is a registered trademark of the VCAA. The VCAA does not endorse or make any warranties regarding this study resource. Past VCE exams and related content can be accessed directly at www.vcaa.vic.edu.au
