SACE Stage 2 Maths Methods Topic Tests
Sampling and Confidence Intervals Topic Test 1
Number of marks: 12
Writing time: 15 minutes
Instructions
• Show appropriate working and steps of logic in the question booklets
• State all answers correct to three significant figures, unless otherwise instructed
• Use black or blue pen
• You may use a sharp dark pencil for diagrams and graphical representations
(a) Consider a scenario where a random sample size of 100 is taken and 23 successes are observed.
(i) Fill in the boxes below to form a 95% confidence interval for the population proportion of successes, \(p\).
\(\le p \le\) (1 mark)
(ii) Does the confidence interval calculated in part (a)(i) contradict the statement that \(p = 0.35\) with 95% confidence? Tick the appropriate box to indicate your answer. (1 mark)
Yes No
(iii) Justify your answer to part (a)(ii). (1 mark)
(b) A mathematician is demonstrating that not all calculated confidence intervals will contain the population proportion being investigated.
The mathematician uses a population that is known to have a population proportion of 0.35. They take 50 independent, randomly generated samples of size 100 and calculate 50 independent 95% confidence intervals.
Figure 5 shows these confidence intervals as vertical lines, where the vertical position of the endpoints of each line represents the limits of each confidence interval. Each confidence interval has been assigned a label from 1 to 50.
The population proportion of 0.35 is represented as a horizontal dashed line.
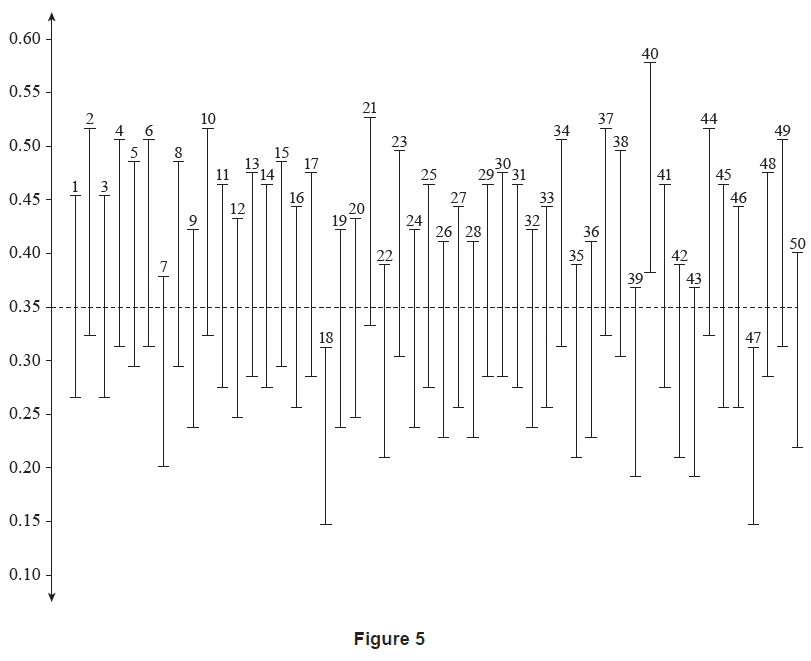
(i) Identify the assigned labels of the three confidence intervals that do not contain the population proportion. (1 mark)
(ii) Identify the assigned label(s) of the confidence interval(s) that could be used to support a claim that the population proportion is greater than 0.35. (1 mark)
When a 95% confidence interval for a population proportion is to be calculated using a random sample of sufficient size, there is a probability of 0.05 that the confidence interval will not contain the population proportion.
(c) Let \(X\) be the number of 95% confidence intervals that will not contain the population proportion out of 100 independent 95% confidence intervals to be calculated.
(i) Assuming that \(X\) can be modelled using a binomial distribution, fill in the boxes below to show the value of the parameters of \(X\). (2 marks)
\(X \sim B(\) , \( ) \)
(ii) If 100 new, independent 95% confidence intervals are to be calculated, determine the probability of observing:
(1) exactly five 95% confidence intervals that will not contain the population proportion. (1 mark)
(2) at least one 95% confidence interval that will not contain the population proportion. (1 mark)
(d) Determine the minimum number of independent 95% confidence intervals that would need to be calculated to have a greater than 0.5 probability of having at least one 95% confidence interval that will not contain the population proportion. (3 marks)
end of booklet
Sampling and Confidence Intervals Topic Test 2
Number of marks: 14
Writing time: 18 minutes
Instructions
• Show appropriate working and steps of logic in the question booklets
• State all answers correct to three significant figures, unless otherwise instructed
• Use black or blue pen
• You may use a sharp dark pencil for diagrams and graphical representations
The daily milk production of a randomly chosen milking cow varies, and can be modelled by a normal distribution with a mean of \(\mu = 21.9\) litres and a standard deviation of \(\sigma = 3.26\) litres.
(a) (i) Determine the probability that the daily milk production of a randomly selected cow is less than 23 litres. (1 mark)
(ii) Given that 15% of randomly selected cows have a daily milk production of \(c\) litres or more, determine the value of \(c\). (1 mark)
(b) Let the random variable \(S_n\) represent the total daily milk production of a random sample of \(n\) cows. Explain why it is appropriate to model \(S_n\) using a normal distribution. (1 mark)
Recall that the daily milk production of a randomly chosen milking cow can be modelled by a normal distribution with a mean of \(\mu=21.9\) litres and a standard deviation of \(\sigma=3.26\) litres.
(c) Let the random variable \(S_{90}\) represent the total daily milk production of a random sample of 90 cows.
(i) Show that the mean of \(S_{90}\) is \(\mu_{S_{90}} = 1971\) litres and standard deviation of \(S_{90}\) is \(\sigma_{S_{90}} = 30.93\) litres (correct to four significant figures). (2 marks)
(ii) Determine the probability that the total daily milk production of a random sample of 90 cows is:
(1) between 1900 litres and 1950 litres. (1 mark)
(2) more than 2000 litres. (1 mark)
A farmer owns 90 cows, which can be considered a random sample for the purposes of this question. The farmer aims to increase their cows' total mean daily milk production by adopting a new feeding plan for the cows. The farmer randomly selects 20 cows for the new feeding plan. In this random sample of 20 cows, the mean daily milk production after some time on the new feeding plan is 23.5 litres per cow.
(d) Calculate a 95% confidence interval for the mean daily milk production per cow on the new feeding plan. Assume that the standard deviation is still \(\sigma = 3.26\) litres. (2 marks)
(e) Does the confidence interval calculated in part (d) suggest with 95% confidence that the new feeding plan has increased the mean daily milk production per cow? Justify your answer. (2 marks)
(f) The farmer would like the 90 cows' mean total daily milk production to be more than 2000 litres.
(i) Determine the mean daily milk production per cow if 90 cows had a total daily milk production of 2000 litres. (1 mark)
(ii) Hence or otherwise, does the confidence interval calculated in part (d) suggest with 95% confidence that the new feeding plan will result in the 90 cows' mean total daily milk production being more than 2000 litres? Justify your answer. (2 marks)
end of booklet
Sampling and Confidence Intervals Topic Test 3
Number of marks: 10
Writing time: 13 minutes
Instructions
• Show appropriate working and steps of logic in the question booklets
• State all answers correct to three significant figures, unless otherwise instructed
• Use black or blue pen
• You may use a sharp dark pencil for diagrams and graphical representations
Astro Cats cards are a type of trading card. Among ordinary Astro Cats cards, gold cards can be found by chance. The probability that a single randomly selected card is a gold card is 0.035. The trading cards are sold in packs of 10 randomly selected cards.

(a) Assume that the number of gold cards found in packs of cards can be modelled using a binomial distribution.
(i) For one randomly selected pack of cards, calculate the:
(1) expected number of gold cards. (1 mark)
(2) probability of finding exactly one gold card. (1 mark)
(3) probability of finding more than two gold cards. (2 marks)
(ii) A collector states that in 12 randomly selected packs of cards there is a 100% chance of finding at least one gold card. Calculate the relevant probability to show that the collector's statement is incorrect. (1 mark)
Packs of Astro Cats trading cards may also contain platinum cards. These cards are rare, and the manufacturer does not publicly state how many are made. However, a website claims that the proportion of platinum cards produced is no more than 0.004.
(b) To assess the accuracy of the website's claim, a collector investigated their 1200 packs of 10 cards and found that these packs contained 51 platinum cards. The collector's 1200 packs of 10 cards can be considered a random sample for the purposes of this question.
(i) Show that the proportion of platinum cards in this sample is 0.00425. (1 mark)
(ii) Calculate a 90% confidence interval for the proportion of all cards that are platinum cards. (2 marks)
(iii) Hence, at the 90% confidence level, does the confidence interval that you calculated in part (b)(ii) support the website's claim? Justify your answer. (2 marks)
end of booklet
Sampling and Confidence Intervals Topic Test 4
Number of marks: 10
Writing time: 13 minutes
Instructions
• Show appropriate working and steps of logic in the question booklets
• State all answers correct to three significant figures, unless otherwise instructed
• Use black or blue pen
• You may use a sharp dark pencil for diagrams and graphical representations
A company produces a type of fruit-filled chocolate called Choc-pricots. They are produced on an automated assembly line that can result in imperfect Choc-pricots.
(a) The probability is 0.15 that a Choc-pricot randomly selected off the assembly line is imperfect. Use the binomial distribution to determine the probability that, in a random sample of 80 Choc-pricots:
(i) exactly 6 Choc-pricots will be imperfect. (1 mark)
(ii) more than 20 Choc-pricots will be imperfect. (2 marks)
The manager of the assembly line can adjust the rate of production of Choc-pricots, resulting in a change in the probability that a randomly selected Choc-pricot is imperfect. This probability can be modelled by the function \[ p(x) = \sin(0.00392x^2) + e^{-x}, \text{ for } 0 < x \le 20, \] where \(p(x)\) represents the probability that a randomly selected Choc-pricot is imperfect, and \(x\) represents the rate of production measured in Choc-pricots per second.
(b) On the axes in Figure 8, sketch the graph of \(y=p(x)\). (3 marks)
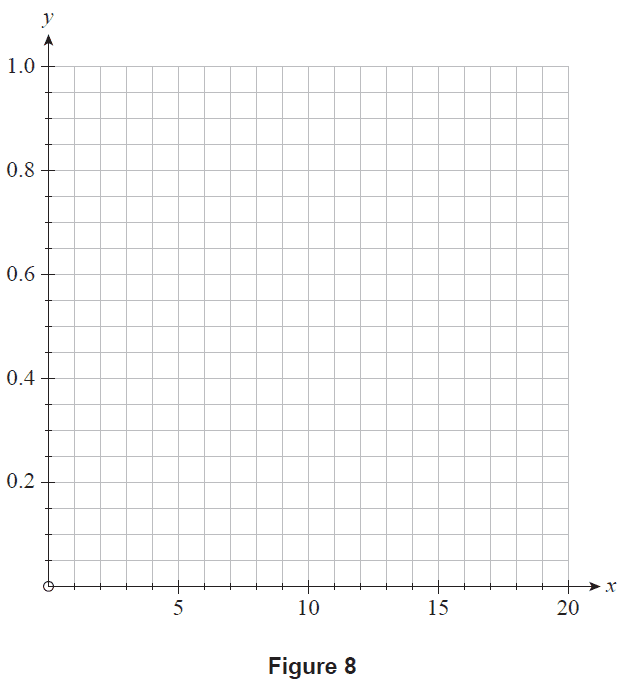
Figure 8
(c) Using the function \(p(x)\), determine the possible rate(s) of production that resulted in the given probability of 0.15 stated in part (a). (2 marks)
(d) The minimum probability that a randomly selected Choc-pricot is imperfect, according to the function \(p(x)\), is 0.0781 (correct to three significant figures). State the corresponding rate of production that would result in this probability. (1 mark)
(e) The manager chooses a new production rate for the assembly line. They claim that the production rate that they have chosen will result in the minimum probability that a randomly selected Choc-pricot is imperfect.
After running the assembly line at the new production rate for one day, a quality-control officer randomly selects 80 Choc-pricots and 6 are imperfect.
(i) Calculate \(\hat{p}\), the proportion of Choc-pricots that are imperfect in the sample of 80 Choc-pricots manufactured at the new production rate. (1 mark)
(ii) Assuming that a sample size of 80 is large enough for the central limit theorem to apply, determine a 90% confidence interval for the proportion of Choc-pricots that will be imperfect at the new production rate. (2 marks)
(iii) Using the confidence interval that you calculated in part (e)(ii), can it be concluded that the manager's claim is false with 90% confidence? Justify your answer. (2 marks)
(iv) Using the confidence interval that you calculated in part (e)(ii) and \(p(x)\), determine with 90% confidence the upper and lower bounds of the new production rate. (2 marks)
end of booklet
Sampling and Confidence Intervals Topic Test 5
Number of marks: 7
Writing time: 10 minutes
Instructions
• Show appropriate working and steps of logic in the question booklets
• State all answers correct to three significant figures, unless otherwise instructed
• Use black or blue pen
• You may use a sharp dark pencil for diagrams and graphical representations
The leading digit of a number is defined as the left-most non-zero digit. In the numbers given below, for example, 7 is the leading digit.
712 \(\qquad\) 74.2 \(\qquad\) 0.00798
Let \(X\) represent the leading digit of a naturally occurring number. Benford's law states that the leading digits in large sets of naturally occurring numbers are distributed as follows:
| \(x\) | 1 | 2 | 3 | 4 | 5 | 6 | 7 | 8 | 9 |
| \(\Pr(X=x)\) | 0.301 | 0.176 | 0.125 | 0.097 | 0.079 | 0.067 | 0.058 | 0.051 | 0.046 |
(a) What property of the values in the table above mean that \(X\) is not uniformly distributed? (1 mark)
(b) Determine the probability of randomly selecting a naturally occurring number with a leading digit of 6 or greater. (1 mark)
(c) Identify which of the following provides a correct calculation for the mean of the leading digit of a naturally occurring number, \(\mu_X\). Tick the appropriate box. (1 mark)
\(\mu_X = 1^2(0.301) + 2^2(0.176) + 3^2(0.125) + 4^2(0.097) + 5^2(0.079) + 6^2(0.067) + 7^2(0.058) + 8^2(0.051) + 9^2(0.046)\)
\(\mu_X = 1(0.301) + 2(0.176) + 3(0.125) + 4(0.097) + 5(0.079) + 6(0.067) + 7(0.058) + 8(0.051) + 9(0.046)\)
\(\mu_X = \frac{0.301+0.176+0.125+0.097+0.079+0.067+0.058+0.051+0.046}{9}\)
(d) Benford's law can be used to detect fraudulent financial records. Further investigation of a company's financial records is undertaken if a calculated 95% confidence interval supports the claim that the mean of the leading digit of the financial records is greater than 3.441.
Consider a random sample of 250 numbers from a company's records. The mean of the leading digit in this sample is \(\bar{x} = 3.816\).
(i) Calculate a 95% confidence interval for the mean of the leading digit of the company's financial records, using the random sample described above. Assume that the standard deviation is \(\sigma_X = 2.462\). (2 marks)
(ii) Does this 95% confidence interval suggest that further investigation should be undertaken? Justify your answer. (2 marks)
end of booklet