SACE Stage 2 Maths Methods Topic Tests
Integral Calculus Topic Test 1
Number of marks: 13
Writing time: 17 minutes
Instructions
• Show appropriate working and steps of logic in the question booklets
• State all answers correct to three significant figures, unless otherwise instructed
• Use black or blue pen
• You may use a sharp dark pencil for diagrams and graphical representations
Consider the function \(f(x) = e^{-\cos x}\) for \(0 \le x \le 2\pi\) with derivative \(f'(x) = e^{-\cos x}\sin x\). Figure 9 shows the graph of \(y=f(x)\) and \(y=f'(x)\). The two functions touch at \(P\).
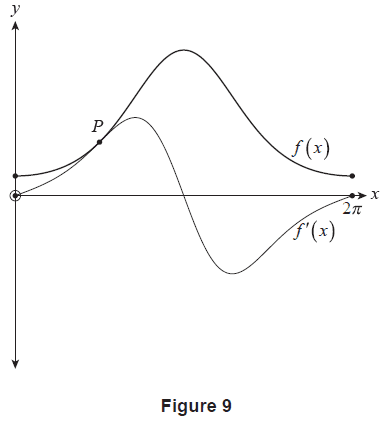
(a) Use an algebraic approach to determine the exact \(x\)-coordinate of \(P\). (3 marks)
Recall that \(f(x) = e^{-\cos x}\) for \(0 \le x \le 2\pi\) with derivative \(f'(x) = e^{-\cos x}\sin x\).
(b) (i) Show that \(f''(x) = e^{-\cos x}(-\cos^2 x + \cos x + 1)\).
Note that \(\cos^2 x + \sin^2 x = 1\). (2 marks)
(ii) Hence, use an algebraic approach to determine the values of \(x\) such that \(f''(x) = f(x)\). (3 marks)
Figure 10 shows the graph of \(y=f'(x)\) and \(y=f''(x)\), which intersect when \(x=k\) and at one other point. The two distinct regions enclosed between the two functions from \(x=k\) to \(x=2\pi\) are denoted as \(A\) and \(B\), as shown in Figure 10. The areas of these regions are measured in units squared.
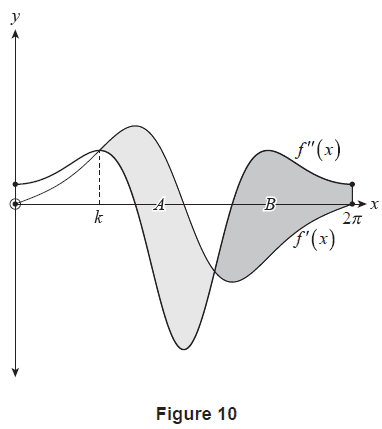
(c) Use part (a) and part (b)(ii) to explain why \(k = \frac{\pi}{2}\). (1 mark)
(d) Use an algebraic approach to determine the exact difference in area between region \(A\) and region \(B\). (4 marks)
end of booklet
Integral Calculus Topic Test 2
Number of marks: 9
Writing time: 12 minutes
Instructions
• Show appropriate working and steps of logic in the question booklets
• State all answers correct to three significant figures, unless otherwise instructed
• Use black or blue pen
• You may use a sharp dark pencil for diagrams and graphical representations
Car A and Car B are toy cars powered by compressed carbon dioxide. After they are released from a starting point, the cars travel only forwards in a straight line, and are observed for exactly 2 seconds.
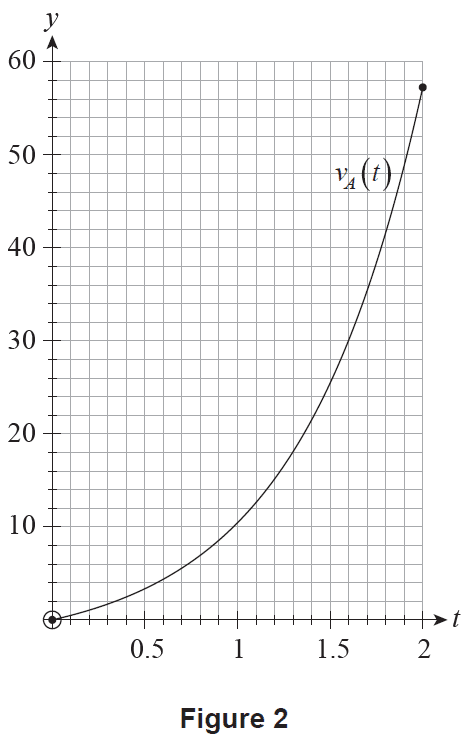
Car A's velocity \(t\) seconds after it is released, \(v_A(t)\), can be modelled using the function \[ v_A(t) = 3e^{1.5t} - 3 \] where \(v_A(t)\) is measured in metres per second and \(t\) is measured in seconds for \(0 \le t \le 2\).
This image has been removed
for copyright reasons.
Source: adapted from © LEAP Australia |
www.computationalfluiddynamics.com.au
(a) Determine Car A's velocity 1 second after it is released. (1 mark)
(b) Let \(s_A(t)\) be a function that models the displacement of Car A from the starting point \(t\) seconds after it is released.
(i) Show that \(s_A(t) = 2e^{1.5t} - 3t - 2\). Assume that \(s_A(0) = 0\). (2 marks)
(ii) Hence or otherwise, determine the displacement of Car A from the starting point 2 seconds after it is released. (1 mark)
The graph of \(y = v_A(t)\) is shown in Figure 2.
Car B's velocity \(t\) seconds after it is released, \(v_B(t)\), can be modelled using the function \[ v_B(t) = 6.6t^2 + 8t \] where \(v_B(t)\) is measured in metres per second and \(t\) is measured in seconds for \(0 \le t \le 2\).
(c) On Figure 2 above, sketch the graph of \(y = v_B(t)\). (2 marks)
(d) For what values of \(t\) was the velocity of Car A greater than the velocity of Car B? (1 mark)
(e) Which car, Car A or Car B, do the models suggest has travelled the furthest during the 2 seconds that they are observed? Justify your answer. (2 marks)
end of booklet
Integral Calculus Topic Test 3
Number of marks: 6
Writing time: 8 minutes
Instructions
• Show appropriate working and steps of logic in the question booklets
• State all answers correct to three significant figures, unless otherwise instructed
• Use black or blue pen
• You may use a sharp dark pencil for diagrams and graphical representations
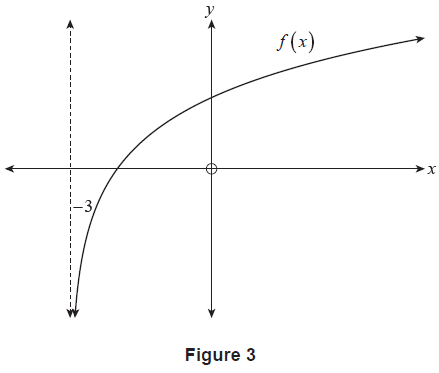
Consider the function (f(x) = ln(x+3)) where (x > -3). A graph of (y = f(x)) is shown in Figure 3.
(a) Determine (f'(x)). (1 mark)
(b) Calculate (f'(0)). (1 mark)
Let (g(x) = bln(x+3)), where (x > -3) and (b) is a positive constant.
Figure 4 shows the graph of (y=f'(x)) and (y=g'(x)). The (y)-intercepts of each graph are labelled (A) and (B) respectively.
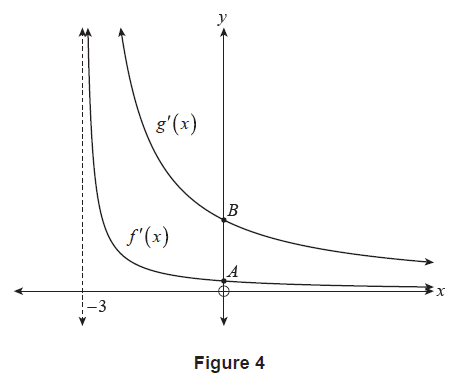
(c) The vertical distance between points (A) and (B) is 2 units. Determine the value of (b). (3 marks)
(d) Hence or otherwise, state the transformation applied to (f(x)) to obtain (g(x)). (1 mark)
Consider the function (f(x) = frac{x}{x-2}), where (x ne 2).
(a) Use first principles to find (f'(x)). (4 marks)
(b) Hence or otherwise, state the slope of the tangent to (f(x)) when (x=6). (1 mark)
end of booklet
Integral Calculus Topic Test 4
Number of marks: 10
Writing time: 13 minutes
Instructions
• Show appropriate working and steps of logic in the question booklets
• State all answers correct to three significant figures, unless otherwise instructed
• Use black or blue pen
• You may use a sharp dark pencil for diagrams and graphical representations
The rate at which medical samples arrive at a laboratory \(t\) hours after 8.00 am on a particular day can be modelled using the function \[ m(t) = 500t\sqrt{t} e^{-0.9t} \text{ for } 0 \le t \le 9, \] where the rate at which medical samples arrive at the laboratory, \(m(t)\), is measured in samples per hour.
(a) (i) Show that \(m'(t) = 750\sqrt{t}e^{-0.9t} - 450t\sqrt{t}e^{-0.9t}\). (2 marks)
(ii) Hence, using an algebraic approach, show that the rate at which medical samples arrive at the laboratory is maximised at \(t = \frac{5}{3}\), according to the model. (3 marks)
Let the total number of medical samples that arrive at the laboratory between 8.00 am and 5.00 pm on a particular day be \(N\).
(b) An overestimate for the value of \(N\) can be calculated using three rectangles of equal width. These three rectangles, along with the graph of \(y=m(t)\) where \(0 \le t \le 9\), are shown in Figure 4.
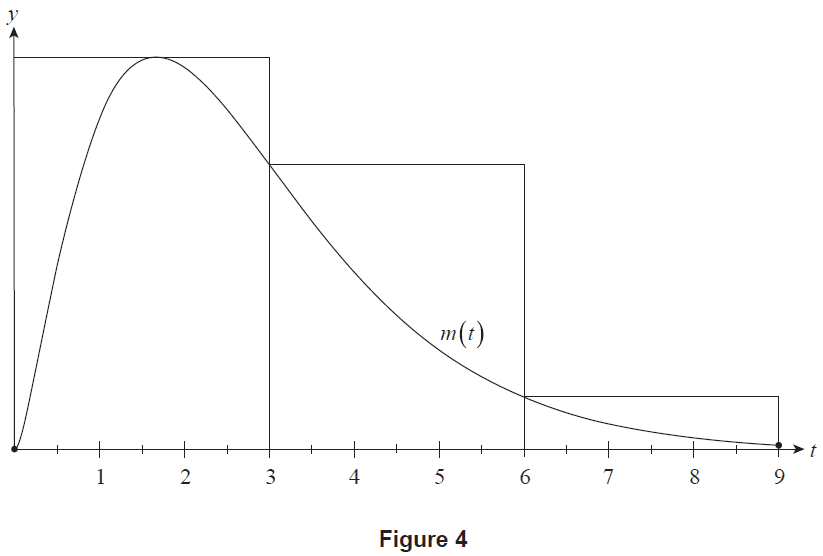
Figure 4
(i) Calculate the value of this overestimate. (2 marks)
(ii) If an overestimate of \(N\) was calculated using an increasing number of rectangles of equal width, it would approach the true value of \(N\). Calculate this value of \(N\), correct to the nearest integer. (1 mark)
When a medical sample arrives at the laboratory, it is placed in a queue before being processed. The medical samples are processed at a constant rate of 150 samples per hour. Let the function \(p(t)=150\) represent the rate at which medical samples are processed. Figure 5 shows the graphs of \(y=m(t)\) and \(y=p(t)\), where \(0 \le t \le 9\). The graphs of \(y=m(t)\) and \(y=p(t)\) intersect at \(t=0.670\) and \(t=3.36\) (correct to three significant figures).
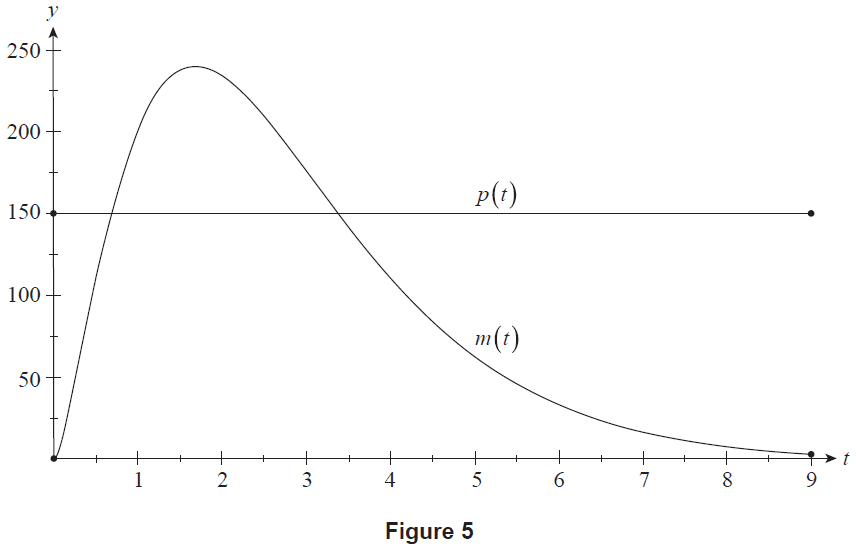
Figure 5
(c) At 8.00 am (\(t=0\)), the laboratory had 600 medical tests in the queue to be processed.
(i) Explain why the number of items in the queue is decreasing until 0.670 hours after 8.00 am. (1 mark)
(ii) During the time that the number of items in the queue was increasing, the queue increased by \(K\) medical samples.
(1) Write an integral expression that could be used to calculate \(K\). (2 marks)
(2) Hence, or otherwise, determine the value of \(K\), correct to the nearest integer. (1 mark)
(iii) Determine the number of medical samples in the queue at 5.00 pm. (2 marks)
end of booklet
Integral Calculus Topic Test 5
Number of marks: 10
Writing time: 13 minutes
Instructions
• Show appropriate working and steps of logic in the question booklets
• State all answers correct to three significant figures, unless otherwise instructed
• Use black or blue pen
• You may use a sharp dark pencil for diagrams and graphical representations
The rate at which medical samples arrive at a laboratory \(t\) hours after 8.00 am on a particular day can be modelled using the function \[ m(t) = 500t\sqrt{t} e^{-0.9t} \text{ for } 0 \le t \le 9, \] where the rate at which medical samples arrive at the laboratory, \(m(t)\), is measured in samples per hour.
(a) (i) Show that \(m'(t) = 750\sqrt{t}e^{-0.9t} - 450t\sqrt{t}e^{-0.9t}\). (2 marks)
(ii) Hence, using an algebraic approach, show that the rate at which medical samples arrive at the laboratory is maximised at \(t = \frac{5}{3}\), according to the model. (3 marks)
Let the total number of medical samples that arrive at the laboratory between 8.00 am and 5.00 pm on a particular day be \(N\).
(b) An overestimate for the value of \(N\) can be calculated using three rectangles of equal width. These three rectangles, along with the graph of \(y=m(t)\) where \(0 \le t \le 9\), are shown in Figure 4.
Figure 4
(i) Calculate the value of this overestimate. (2 marks)
(ii) If an overestimate of \(N\) was calculated using an increasing number of rectangles of equal width, it would approach the true value of \(N\). Calculate this value of \(N\), correct to the nearest integer. (1 mark)
When a medical sample arrives at the laboratory, it is placed in a queue before being processed. The medical samples are processed at a constant rate of 150 samples per hour. Let the function \(p(t)=150\) represent the rate at which medical samples are processed. Figure 5 shows the graphs of \(y=m(t)\) and \(y=p(t)\), where \(0 \le t \le 9\). The graphs of \(y=m(t)\) and \(y=p(t)\) intersect at \(t=0.670\) and \(t=3.36\) (correct to three significant figures).
Figure 5
(c) At 8.00 am (\(t=0\)), the laboratory had 600 medical tests in the queue to be processed.
(i) Explain why the number of items in the queue is decreasing until 0.670 hours after 8.00 am. (1 mark)
(ii) During the time that the number of items in the queue was increasing, the queue increased by \(K\) medical samples.
(1) Write an integral expression that could be used to calculate \(K\). (2 marks)
(2) Hence, or otherwise, determine the value of \(K\), correct to the nearest integer. (1 mark)
(iii) Determine the number of medical samples in the queue at 5.00 pm. (2 marks)
end of booklet
Integral Calculus Topic Test 6
Number of marks: 12
Writing time: 15 minutes
Instructions
• Show appropriate working and steps of logic in the question booklets
• State all answers correct to three significant figures, unless otherwise instructed
• Use black or blue pen
• You may use a sharp dark pencil for diagrams and graphical representations
A company produces bags of sand which are sold with a labelled net weight of 400 grams. The machine that fills these bags has a stopping mechanism that is designed to stop adding sand when the net weight of the sand in a bag first reaches 400 grams. However, sand often escapes the stopping mechanism, resulting in bags containing excess sand.
The net weight, in grams, of the sand in the bags, \(X\), can be modelled by the probability density function \[ f(x) = \frac{k}{x} \] where \(400 \le x \le 440\) and \(k\) is a positive constant.

Source: adapted from
© klyaksun | vecteezy.com
(a) Use an algebraic approach to show that \(k = \frac{1}{\ln 1.1}\). (3 marks)
(b) (i) Calculate \(\int_{400}^{410} \frac{1}{(\ln 1.1)x} \,dx\). (1 mark)
(ii) Interpret your answer to part (b)(i) in the context of the problem. (1 mark)
(c) Show that the mean of \(X\) is \(\mu_X = \frac{40}{\ln 1.1}\) grams. (3 marks)
(d) The company alters the stopping mechanism in order to reduce the amount of excess sand in the bags.
After the stopping mechanism has been altered, they take a random sample of 25 bags of sand and find that the mean net weight of the sand in these bags is 417 grams. Assume that the standard deviation is \(\sigma_X = 11.5\) grams and the sample size is large enough for the central limit theorem to apply.
(i) Calculate the 99% confidence interval for the mean net weight of the sand in the bags after the stopping mechanism was altered. (2 marks)
(ii) The company claims that after the stopping mechanism was altered, the mean net weight of the sand in the bags has reduced. Does the confidence interval calculated in part (d)(i) support this claim with 99% confidence? Justify your answer. (2 marks)
end of booklet